Now trading at a price of $88.06, US Foods has moved -4.3% so far today.
US Foods returned gains of 28.2% last year, with its stock price reaching a high of $102.13 and a low of $68.8. Over the same period, the stock underperformed the S&P 500 index by -1.8%. The company's 50-day average price was $91.88. US Foods Holding Corp., together with its subsidiaries, markets, sells, and distributes fresh, frozen, and dry food and non-food products to foodservice customers in the United States. Based in Rosemont, IL, the Large-Cap Consumer Discretionary company has 30,000 full time employees. US Foods has not offered a dividend during the last year.
The Firm Has a Highly Leveraged Balance Sheet:
| 2019 | 2021 | 2022 | 2023 | 2024 | 2025 | |
|---|---|---|---|---|---|---|
| Revenue (M) | $25,939 | $22,885 | $29,487 | $35,597 | $37,877 | $39,424 |
| Gross Margins | 18% | 16% | 16% | 17% | 17% | 17% |
| Net Margins | 1% | -1% | 1% | 1% | 1% | 2% |
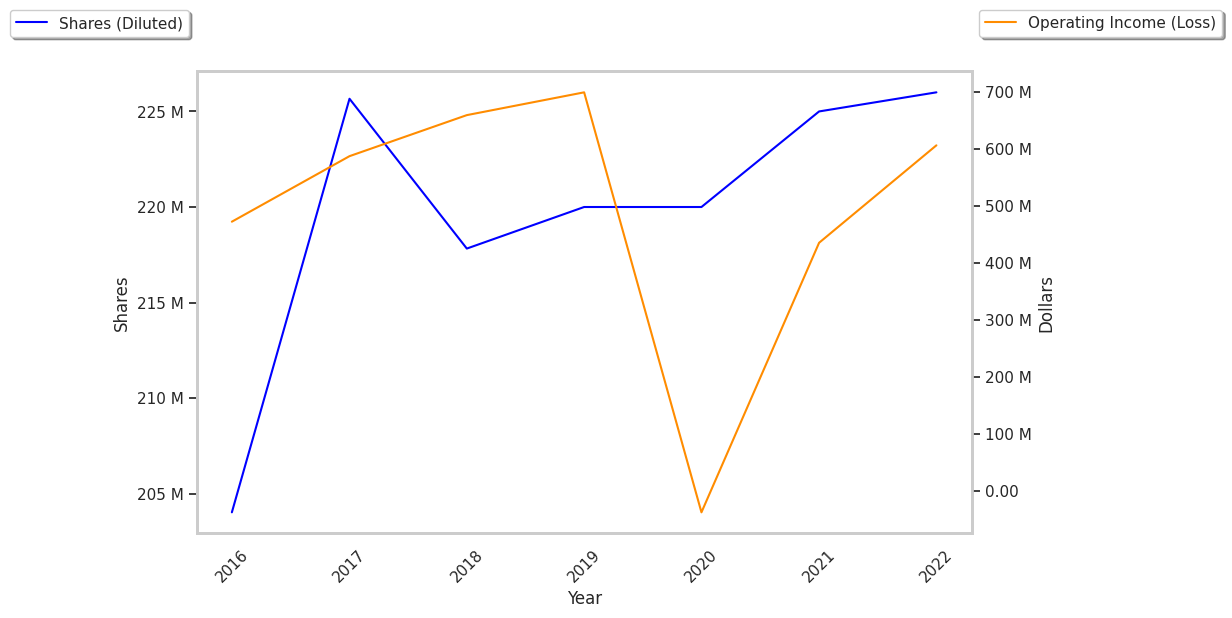
| Net Income (M) | $385 | -$226 | $164 | $506 | $494 | $676 |
| Net Interest Expense (M) | $184 | $238 | $213 | $324 | $284 | $300 |
| Depreciation & Amort. (M) | $311 | $343 | $323 | $349 | $384 | $406 |
| Diluted Shares (M) | 220 | 225 | 226 | 250 | 244 | 230 |
| Earnings Per Share | $1.75 | -$1.15 | $0.54 | $2.02 | $2.02 | $2.94 |
| EPS Growth | n/a | -165.71% | 146.96% | 274.07% | 0.0% | 45.54% |
| Avg. Price | $37.38 | $36.0 | $35.0 | $45.41 | $67.49 | $91.06 |
| P/E Ratio | 21.12 | -31.3 | 63.64 | 21.73 | 32.92 | 30.56 |
| Free Cash Flow (M) | $502 | $224 | $145 | $831 | $833 | $959 |
| CAPEX (M) | $258 | $189 | $274 | $309 | $341 | $410 |
| EV / EBITDA | 12.65 | 47.36 | 10.29 | 10.68 | 14.43 | 16.28 |
| Total Debt (M) | $4,736 | $5,412 | $95 | $4,674 | $4,928 | $5,200 |
| Net Debt / EBITDA | 4.6 | 17.44 | -0.16 | 3.22 | 3.28 | 3.21 |
| Current Ratio | 1.38 | 1.48 | 1.37 | 1.3 | 1.21 | 1.16 |
US Foods has growing revenues and increasing reinvestment in the business, generally positive cash flows, and positive EPS growth. However, the firm suffers from slimmer gross margins than its peers and a highly leveraged balance sheet. Finally, we note that US Foods has just enough current assets to cover current liabilities, as shown by its current ratio of 1.16.
US Foods's Valuation Is in Line With Its Sector Averages:
US Foods has a trailing twelve month P/E ratio of 31.3, compared to an average of 20.93 for the Consumer Discretionary sector. Based on its EPS guidance of $5.64, the company has a forward P/E ratio of 16.3. US Foods's PEG ratio is 2.4 on the basis of the 13.0% weighted average of the company and the broader market's EPS compound average growth rates. This suggests that the company's shares are overvalued. Furthermore, US Foods is likely overvalued compared to the book value of its equity, since its P/B ratio of 4.51 is higher than the sector average of 2.93. The company's shares are currently trading 150.2% below their Graham number.
US Foods Has an Analyst Consensus of Some Upside Potential:
The 15 analysts following US Foods have set target prices ranging from $94.0 to $120.0 per share, for an average of $109.33 with a buy rating.
US Foods has an average amount of shares sold short because 4.6% of the company's shares are sold short. Institutions own 108.5% of the company's shares, and the insider ownership rate stands at 0.57%, suggesting a small amount of insider investors. The largest shareholder is Vanguard Group Inc, whose 10% stake in the company is worth $1,926,469,131.