One of Wall Street's biggest winners of the day is EchoStar, a communication equipment company whose shares have climbed 3.7% to a price of $127.15 -- near its average analyst target price of $129.6. SATS outperformed the S&P 500 index by 3.0% during today's evening session, and by 377.3% over the last year with a return of 406.9%.
EchoStar Corporation provides pay-tv services in the United States, Mexico, Canada, South and Central America, Asia, Africa, Australia, Europe, India, and the Middle East. The company is a consumer cyclical company, whose sales figures depend on discretionary income levels in its consumer base. For this reason, consumer cyclical companies have better sales and stock performance during periods of economic growth, when consumers have more of an incentive to spend their money on non-essential items.
EchoStar does not publish either its forward or trailing P/E ratios because their values are negative -- meaning that each share of stock represents a net earnings loss. But we can calculate these P/E ratios anyways using the stocks forward and trailing (EPS) values of $-0.11 and $-50.41. We can see that SATS has a forward P/E ratio of -1115.4 and a trailing P/E ratio of -2.5.
The P/E ratio is the company's share price divided by its earnings per share. In other words, it represents how much investors are willing to spend for each dollar of the company's earnings (revenues minus the cost of goods sold, taxes, and overhead). As of the third quarter of 2024, the consumer discretionary sector has an average P/E ratio of 20.93, and the average for the S&P 500 is 29.3.
We can take the price to earnings analysis one step further by dividing the P/E ratio by the company’s projected five-year growth rate, which gives us its Price to Earnings Growth, or PEG ratio. This ratio is important because it allows us to identify companies that have a low price to earnings ratio because of low growth expectations, or conversely, companies with high P/E ratios because growth is expected to take off.
EchoStar's PEG ratio of 1.33 indicates that its P/E ratio is fair compared to its projected earnings growth. In other words, the company’s valuation accurately reflects its estimated growth potential. The caveat, however, is that these growth estimates could turn out to be inaccurate.
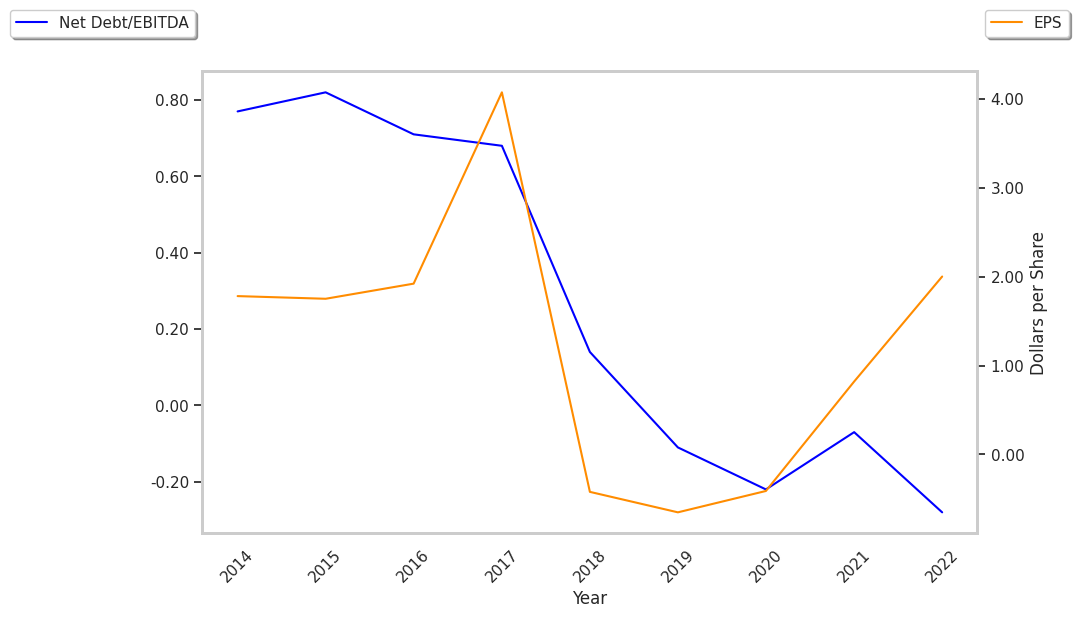
EchoStar's financial viability can also be assessed through a review of its free cash flow trends. Free cash flow refers to the company's operating cash flows minus its capital expenditures, which are expenses related to the maintenance of fixed assets such as land, infrastructure, and equipment. Over the last four years, the trends have been as follows:
| Date Reported | Cash Flow from Operations ($ k) | Capital expenditures ($ k) | Free Cash Flow ($ k) | YoY Growth (%) |
|---|---|---|---|---|
| 2025 | -99,374 | 965,730 | -1,065,104 | -264.54 |
| 2024 | 1,252,697 | 1,544,877 | -292,180 | 56.28 |
| 2023 | 2,432,647 | 3,100,921 | -668,274 | -217.09 |
| 2022 | 3,621,190 | 3,050,472 | 570,718 | -81.2 |
| 2021 | 4,655,373 | 1,619,312 | 3,036,061 | 2317.44 |
| 2020 | 534,388 | 408,798 | 125,590 |
- Average free cash flow: $284.47 Million
- Average free cash flown growth rate: -22.1 %
- Coefficient of variability (lower numbers indicating more stability): 0.0 %
If it weren't negative, the free cash flow would represent the amount of money available for reinvestment in the business, or for payments to equity investors in the form of a dividend. While a negative cash flow for one or two quarters is not a sign of financial troubles for SATS, a long term trend of negative or highly erratic cash flow levels may indicate a struggling business or a mismanaged company.
Another valuation metric for analyzing a stock is its Price to Book (P/B) Ratio, which consists in its share price divided by its book value per share. The book value refers to the present liquidation value of the company, as if it sold all of its assets and paid off all debts.
EchoStar's P/B ratio indicates that the market value of the company exceeds its book value by a factor of 6, so the company's assets may be overvalued compared to the average P/B ratio of the Consumer Discretionary sector, which stands at 2.93 as of the third quarter of 2024.
EchoStar is by most measures overvalued because it has a negative P/E ratio., a higher than Average P/B Ratio, and positive cash flows with a downwards trend. The stock has poor growth indicators because it has a no PEG ratio and with a negative growth trend. We hope you enjoyed this overview of SATS's fundamentals.