Caterpillar logged a 3.3% change during today's evening session, and is now trading at a price of $926.79 per share.
Caterpillar returned gains of 162.0% last year, with its stock price reaching a high of $931.35 and a low of $336.24. Over the same period, the stock outperformed the S&P 500 index by 135.4%. More recently, the company's 50-day average price was $764.25. Caterpillar Inc. provides construction and mining equipment, off-highway diesel and natural gas engines, industrial gas turbines, and diesel-electric locomotives in the United States and internationally. Based in Irving, TX, the Large-Cap Industrials company has 118,000 full time employees. Caterpillar has offered a 0.7% dividend yield over the last 12 months.
Growing Revenues but Slimmer Gross Margins than the Industry Average of 20.23%:
| 2020 | 2021 | 2022 | 2023 | 2024 | 2025 | |
|---|---|---|---|---|---|---|
| Revenue (M) | $41,748 | $50,971 | $59,427 | $67,060 | $64,809 | $67,589 |
| Gross Margins | 11% | 13% | 13% | 19% | 20% | 16% |
| Net Margins | 7% | 13% | 11% | 15% | 17% | 13% |
| Net Income (M) | $3,003 | $6,489 | $6,705 | $10,335 | $10,792 | $8,884 |
| Net Interest Expense (M) | $1,089 | $920 | $959 | $1,435 | $1,738 | $1,842 |
| Depreciation & Amort. (M) | $2,122 | $2,050 | $1,937 | $1,929 | $1,983 | $2,093 |
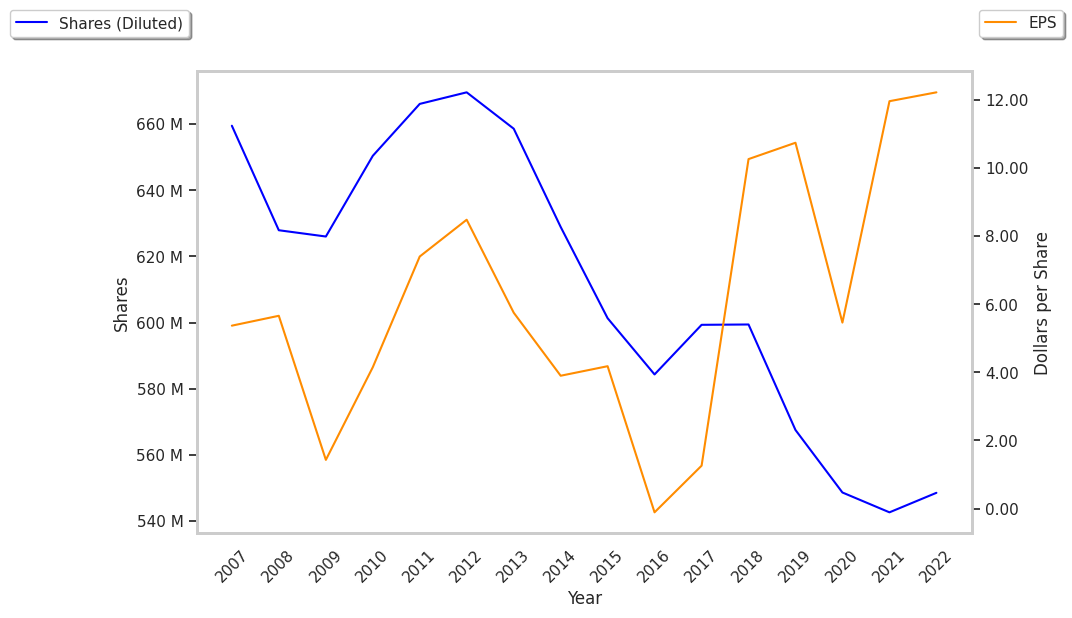
| Diluted Shares (M) | 549 | 548 | 530 | 514 | 489 | 472 |
| Earnings Per Share | $5.46 | $11.83 | $12.64 | $20.12 | $22.05 | $18.81 |
| EPS Growth | n/a | 116.67% | 6.85% | 59.18% | 9.59% | -14.69% |
| Avg. Price | $130.5 | $203.09 | $203.41 | $295.67 | $362.74 | $897.45 |
| P/E Ratio | 23.68 | 17.02 | 15.99 | 14.61 | 16.36 | 47.48 |
| Free Cash Flow (M) | $5,349 | $6,105 | $6,470 | $11,288 | $10,047 | $8,918 |
| CAPEX (M) | $978 | $1,093 | $1,296 | $1,597 | $1,988 | $2,821 |
| EV / EBITDA | 16.68 | 16.68 | 14.71 | 10.92 | 12.36 | 32.54 |
| Total Debt (M) | $49,545 | $49,302 | $46,753 | $21,985 | $19,622 | $23,312 |
| Net Debt / EBITDA | 6.02 | 4.49 | 4.04 | 1.01 | 0.85 | 1.01 |
| Current Ratio | 1.53 | 1.46 | 1.39 | 1.35 | 1.42 | 1.44 |
Caterpillar has growing revenues and increasing reinvestment in the business and exceptional EPS growth. Additionally, the company's financial statements display generally positive cash flows and healthy leverage levels. However, the firm has slimmer gross margins than its peers. Finally, we note that Caterpillar has just enough current assets to cover current liabilities, as shown by its current ratio of 1.44.
Caterpillar's Valuation Is in Line With Its Sector Averages:
Caterpillar has a trailing twelve month P/E ratio of 38.0, compared to an average of 24.03 for the Industrials sector. Based on its EPS guidance of $29.43, the company has a forward P/E ratio of 26.0. According to the 27.2% compound average growth rate of Caterpillar's historical and projected earnings per share, the company's PEG ratio is 1.4. Taking the weighted average of the company's EPS CAGR and the broader market's 5-year projected EPS growth rate, we obtain a normalized growth rate of 16.0%. On this basis, the company's PEG ratio is 2.38. This suggests that these shares are overvalued. Furthermore, Caterpillar is likely overvalued compared to the book value of its equity, since its P/B ratio of 22.88 is higher than the sector average of 2.89. Ultimately, Caterpillar's strong cash flows, decent earnings multiple, and healthy debt levels factor towards it being fairly valued, its elevated P/B ratio notwithstanding.
There's an Analyst Consensus of Little Upside Potential for Caterpillar:
The 26 analysts following Caterpillar have set target prices ranging from $575.0 to $1165.0 per share, for an average of $903.68 with a buy rating.
Caterpillar has a very low short interest because 1.6% of the company's shares are sold short. Institutions own 76.4% of the company's shares, and the insider ownership rate stands at 0.22%, suggesting a small amount of insider investors. The largest shareholder is Blackrock Inc., whose 8% stake in the company is worth $33,557,929,786.