A strong performer from today's evening trading session is JP Morgan Chase &, whose shares rose 1.7% to $305.02 per share. For those of you thinking about investing in the stock, here is a brief value analysis of the stock using the company's basic fundamental ratios.
a Very Low P/E Ratio but Priced Beyond Its Margin of Safety:
JPMorgan Chase & Co. operates as a bank and financial holding company in the United States, rest of North America, Europe, the Middle East, Africa, the Asia Pacific, Latin America, and the Caribbean. The company belongs to the Finance sector, which has an average price to earnings (P/E) ratio of 15.92 and an average price to book (P/B) ratio of 1.78. In contrast, JP Morgan Chase & has a trailing 12 month P/E ratio of 14.6 and a P/B ratio of 2.38.
JP Morgan Chase &'s PEG ratio is 1.6, which shows that the stock is probably overvalued in terms of its estimated growth. For reference, a PEG ratio near or below 1 is a potential signal that a company is undervalued.
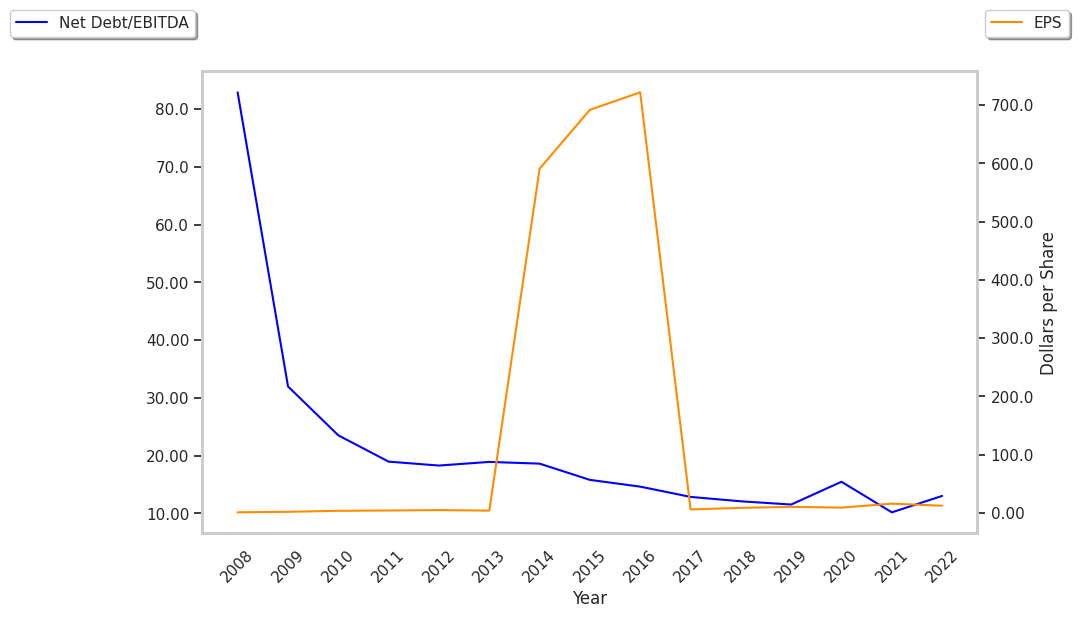
Low Leverage Levels but Negative Cash Flows:
| 2020 | 2021 | 2022 | 2023 | 2024 | 2025 | |
|---|---|---|---|---|---|---|
| Revenue (M) | $119,951 | $121,649 | $128,695 | $158,104 | $177,556 | $182,447 |
| Interest Income (M) | $54,563 | $52,311 | $66,710 | $89,267 | $92,583 | $95,443 |
| Operating Margins | 30% | 49% | 36% | 39% | 42% | 40% |
| Net Margins | 24% | 40% | 28% | 31% | 33% | 31% |
| Net Income (M) | $29,131 | $48,334 | $37,676 | $49,552 | $58,471 | $57,048 |
| Depreciation & Amort. (M) | $8,614 | $7,932 | $7,051 | $7,512 | $7,938 | $8,821 |
| Diluted Shares (M) | 3,087 | 3,027 | 2,970 | 2,943 | 2,879 | 2,782 |
| Earnings Per Share | $8.88 | $15.36 | $12.09 | $16.23 | $19.75 | $20.02 |
| EPS Growth | n/a | 72.97% | -21.29% | 34.24% | 21.69% | 1.37% |
| Avg. Price | $97.08 | $146.27 | $129.11 | $170.1 | $239.39 | $300.0 |
| P/E Ratio | 10.92 | 9.5 | 10.67 | 10.47 | 12.1 | 14.96 |
| Free Cash Flow (M) | -$79,910 | $78,084 | $107,119 | $12,974 | -$42,012 | -$147,782 |
| EV / EBITDA | 1.18 | 0.1 | 2.06 | 3.88 | 7.49 | 11.43 |
| Total Debt (M) | $281,685 | $301,005 | $295,865 | $391,825 | $401,418 | $435,206 |
| Net Debt / EBITDA | -5.54 | -6.52 | -5.1 | -3.36 | -0.82 | 1.13 |
JP Morgan Chase & has strong net margins with a stable trend, low leverage levels, and a strong EPS growth trend. However, the firm has negative cash flows.